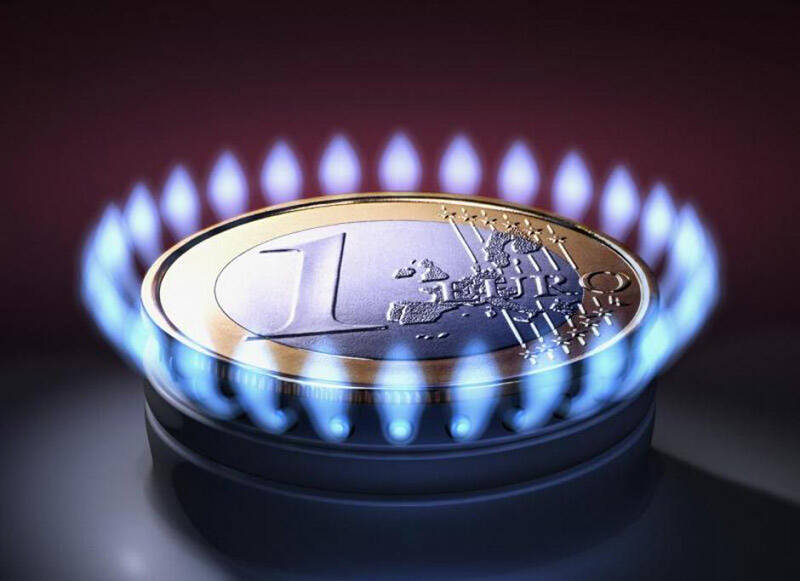
ก๊าซธรรมชาติเป็นรากฐานที่สำคัญของเศรษฐกิจยุโรป
อัปเดทแล้ว • 2022-12-16
Last week, the price of US gas had posted three days of heavy falls. The gas slumped from the highs near $5.5/mmBtu to the lows of $4/MMBtu near the 200-period MA. On Monday, the energy asset opened with a gap below the 200-day moving average. What is going on with this energy asset these days, and should we prepare for further falls?
Currently, the gas price is driven by geopolitical news and the overall risk sentiment in the markets. For sure, the most impactful events for the gas’ price have been happening in Europe. The gas prices in Europe were boosted to an all-time high above 1900 amid the energy crisis in the region and political uncertainties related to a delay in launching of Russia’s Gazprom pipeline called Nord Stream 2. In addition, the certification requirement of Nord Stream 2 in Germany slowed the gas distribution in Europe and pushed the gas prices up. At the same time, the newly identified omicron strain created uncertainties in the market. The risk-off sentiment resulted in investors rebalancing their portfolios and withdrawing their funds from risky assets. As commodities are traditionally viewed as risky investments, gas prices reacted with falls.
Another factor that pulled the gas price down last week was the forecast for warmer winter in North America. The weather outlook for December, January, and February suggests higher temperatures in several US regions. It is a bearish factor for gas.
Given the indeterminacy around the gas supplies coming from Russia, the price has a high chance of an upcoming reversal. However, a clearer picture will be visible within a couple of days. Technically, the gas price gapped below the 200-day MA and tested the support of August at $3.8/mmBtu. Buyers may try to fill in this gap and push the price back to the resistance of $4.20/mmBtu. However, a plunge below the support of $3.8/mmBtu will signal a continuation of the downtrend. In that kind of scenario, the next support will lie at $3.5/mmBtu with a further plunge to $3.15/MMBtu.

Note that if you want to trade gas with FBS, you must choose XNG/USD in MetaTrader or FBS Trader.

ก๊าซธรรมชาติเป็นรากฐานที่สำคัญของเศรษฐกิจยุโรป

ในช่วงสองปีที่ผ่านมา เราได้เห็นการแกว่งตัวของราคาน้ำมันครั้งใหญ่ที่สุดในรอบ 14 ปี ซึ่งทำให้ตลาด นักลงทุน และเทรดเดอร์สับสน เนื่องจากความตึงเครียดทางการเมืองและการเปลี่ยนไปใช้พลังงานสะอาด

หลังจากได้รับแรงกดดันจากทำเนียบขาวมาเป็นเวลาหลายเดือน ซาอุดีอาระเบียก็ยอมผ่อนปรนและตกลงที่จะเพิ่มกำลังการผลิตกับสมาชิก OPEC+ รายอื่นๆ

ก่อนหน้านี้ เรามีการประเมินว่าให้รอเข้าเทรด SELL XAUUSD ที่ระดับ 2,180 ดอลลาร์ โดยสามารถตั้งจุด TP ได้ที่บริเวณ 2,130 ดอลลาร์ และตั้งจุด SL

ก่อนหน้านี้ เรามีการประเมินว่า ให้รอเข้าเทรด BUY NASDAQ (US500) ที่ระดับ 17,200 จุด โดยสามารถตั้งจุด TP ได้ที่บริเวณ 19,300 จุด และตั้งจุด SL

ก่อนหน้านี้ เรามีการประเมินว่า ให้รอเข้าเทรด BUY S&P 500 (US500) ที่ระดับ 4,850 จุด โดยสามารถตั้งจุด TP ได้ที่บริเวณ 5,200 จุด
FBS เก็บรักษาข้อมูลของคุณไว้เพื่อใช้งานเว็บไซต์นี้ เมื่อกดปุ่ม "ยอมรับ" ถือว่าคุณยอมรับ นโยบายความเป็นส่วนตัว ของเรา
เราได้รับคำร้องของคุณแล้ว
ผู้จัดการของเราจะโทรหาคุณในเร็ว ๆ นี้
คำขอโทรกลับครั้งต่อไปสำหรับหมายเลขโทรศัพท์นี้
จะพร้อมใช้งานใน
หากคุณมีปัญหาเร่งด่วนโปรดติดต่อเราผ่านทาง
สนทนาออนไลน์
เกิดข้อผิดพลาดภายใน กรุณาลองใหม่อีกครั้งในภายหลัง
อย่ามัวเสียเวลา - ติดตามดูว่า NFP ส่งผลกระทบอย่างไร ต่อ USD แล้วทำกำไรเลยสิ!
